
The Maldives, an archipelago of nearly 1,200 coral islands scattered across the Indian Ocean, stands as one of the most geographically unique nations in the world. Its low-lying coral atolls, turquoise lagoons, and delicate reef systems form a landscape that is both stunning and fragile. This natural beauty, however, comes with a profound vulnerability. With most islands rising barely two meters above sea level, the Maldives is among the countries most at risk from the changing global climate.
Rising seas, coastal erosion, saltwater intrusion, and stronger storm surges increasingly threaten lives, livelihoods, and infrastructure. Seasonal monsoons continue to shape livelihoods and ecosystems, yet their patterns are becoming increasingly unpredictable. For an island nation so deeply dependent on the ocean, even subtle shifts in temperature, rainfall, and tides can have far-reaching social, environmental, and economic consequences.
Maldives Multihazard Risk Atlas – Volume II
Recognizing the urgency of these challenges, the Government of Maldives, in collaboration with the Asian Development Bank (ADB), developed the Multihazard Risk Atlas – Volume II in March 2020. This comprehensive document consolidates decades of meteorological and geophysical data to map the country’s exposure to climate and natural hazards. It provides essential insights into how the nation’s climate has changed over time and how it is projected to evolve in the future.
This Atlas is a tool for everyone. From planners and councils to schools and communities. It helps us see clearly where risks lie, and how we can prepare for a safer, more resilient Maldives.
Our Climate
The Maldives has two main monsoon seasons that shape our daily lives:
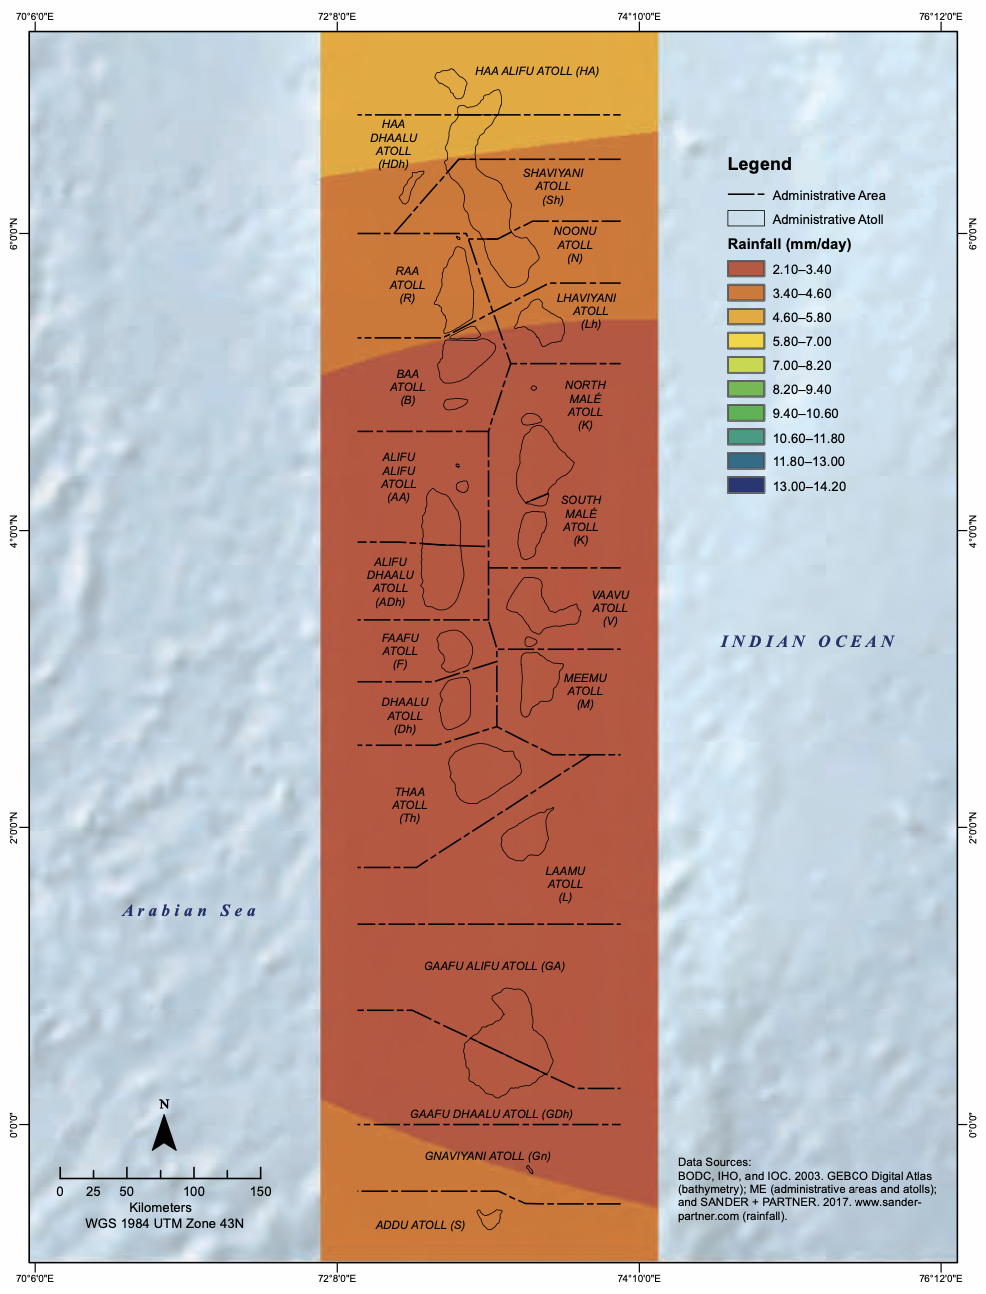
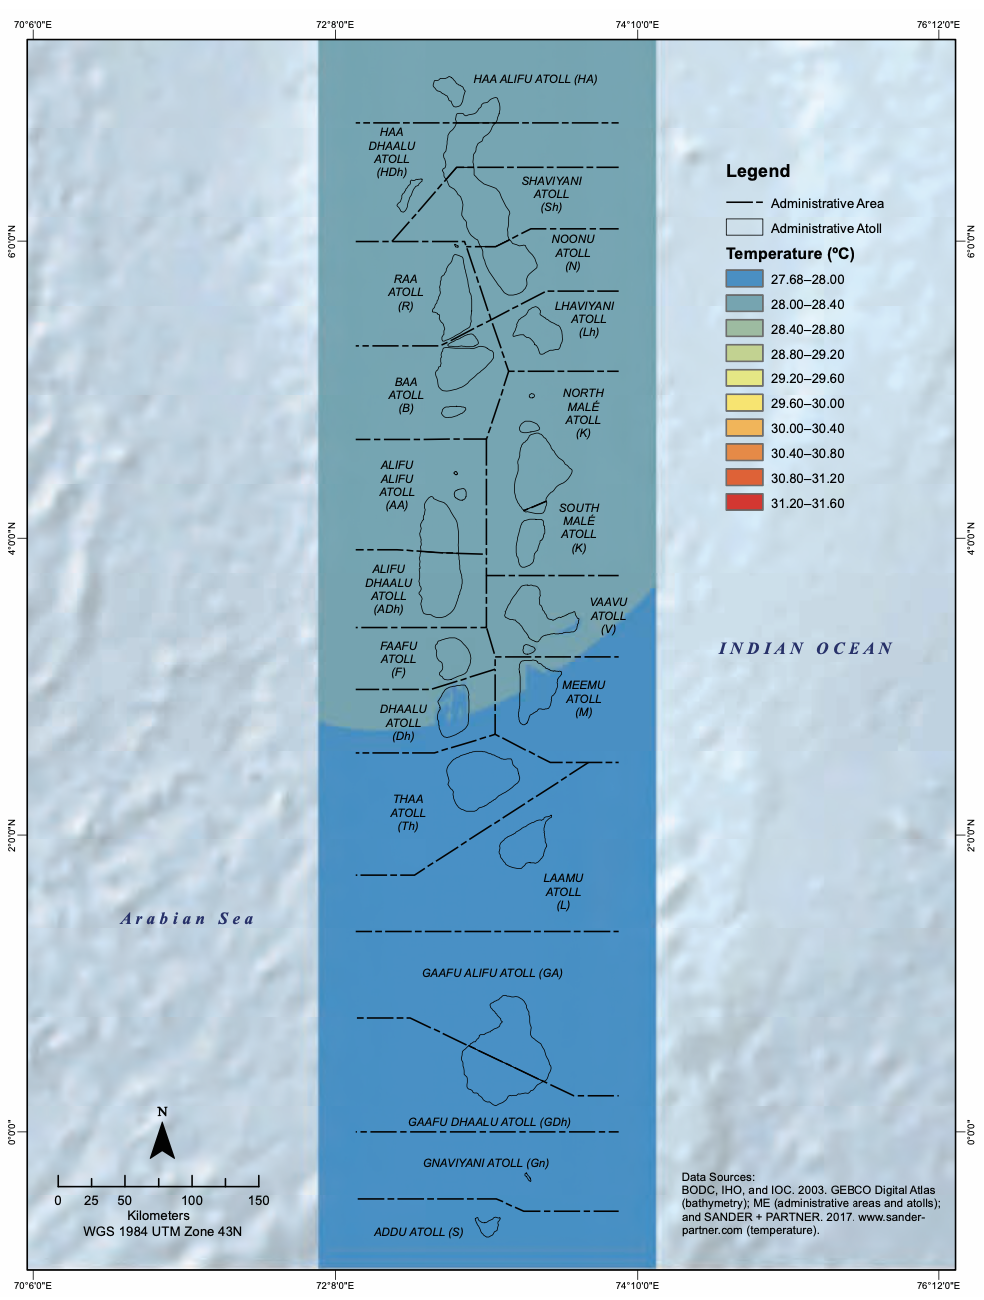
The Atlas offers a detailed view of the Maldives’ tropical climate, shaped by two monsoon systems, the dry northeast monsoon (Iruvai) from November to April and the wet southwest monsoon (Hulhangu) from May to October. While annual temperatures remain fairly consistent across the archipelago (averaging between 26°C and 33°C), rainfall varies significantly from north to south.
The maps provided below illustrate how the northern atolls typically experience heavier rainfall, while the central and southern regions are comparatively drier, showcasing patterns that influence agriculture, water supply, and reef ecosystems.
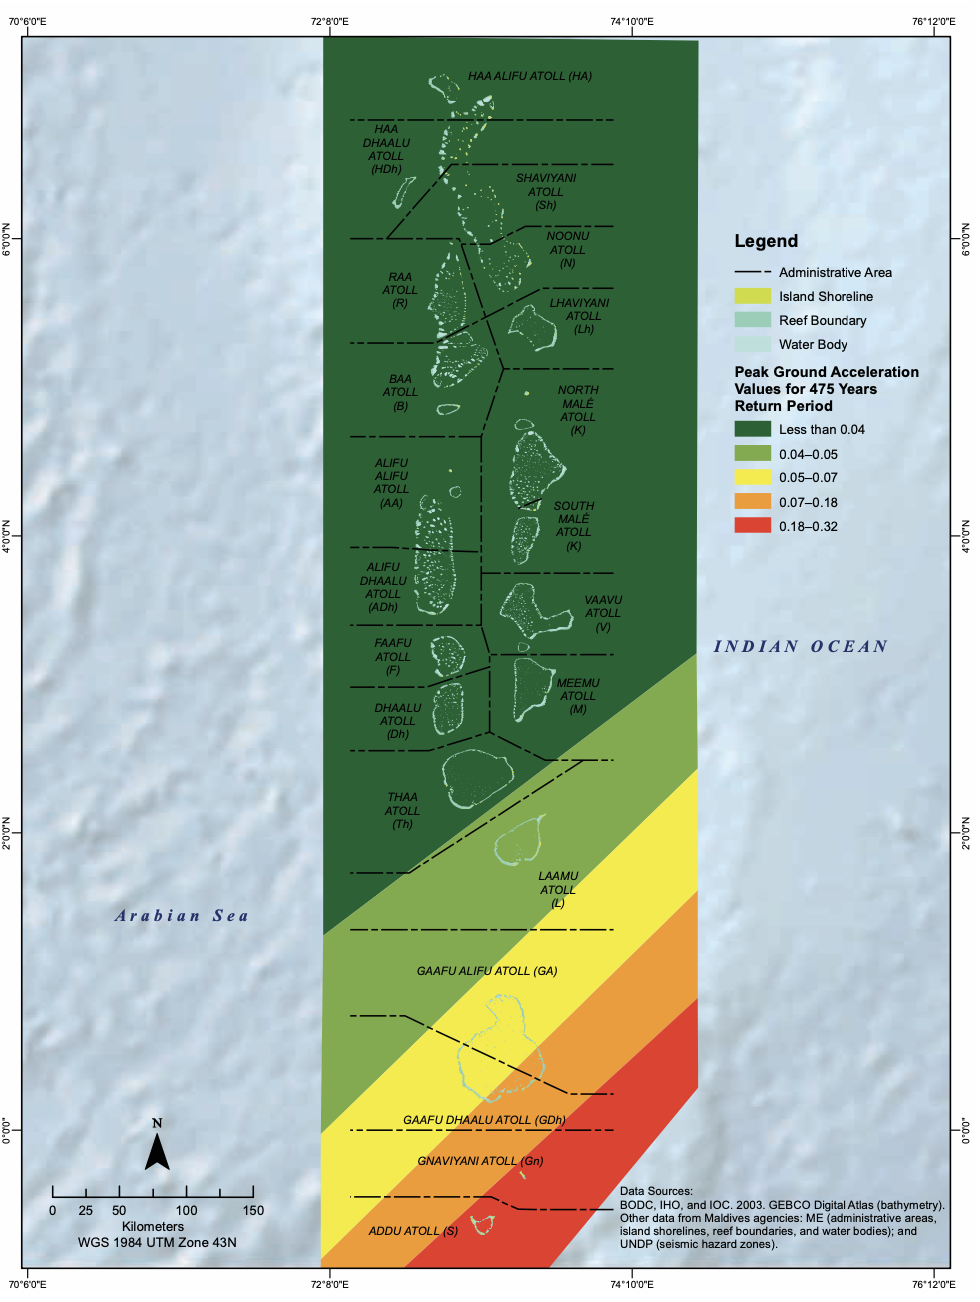
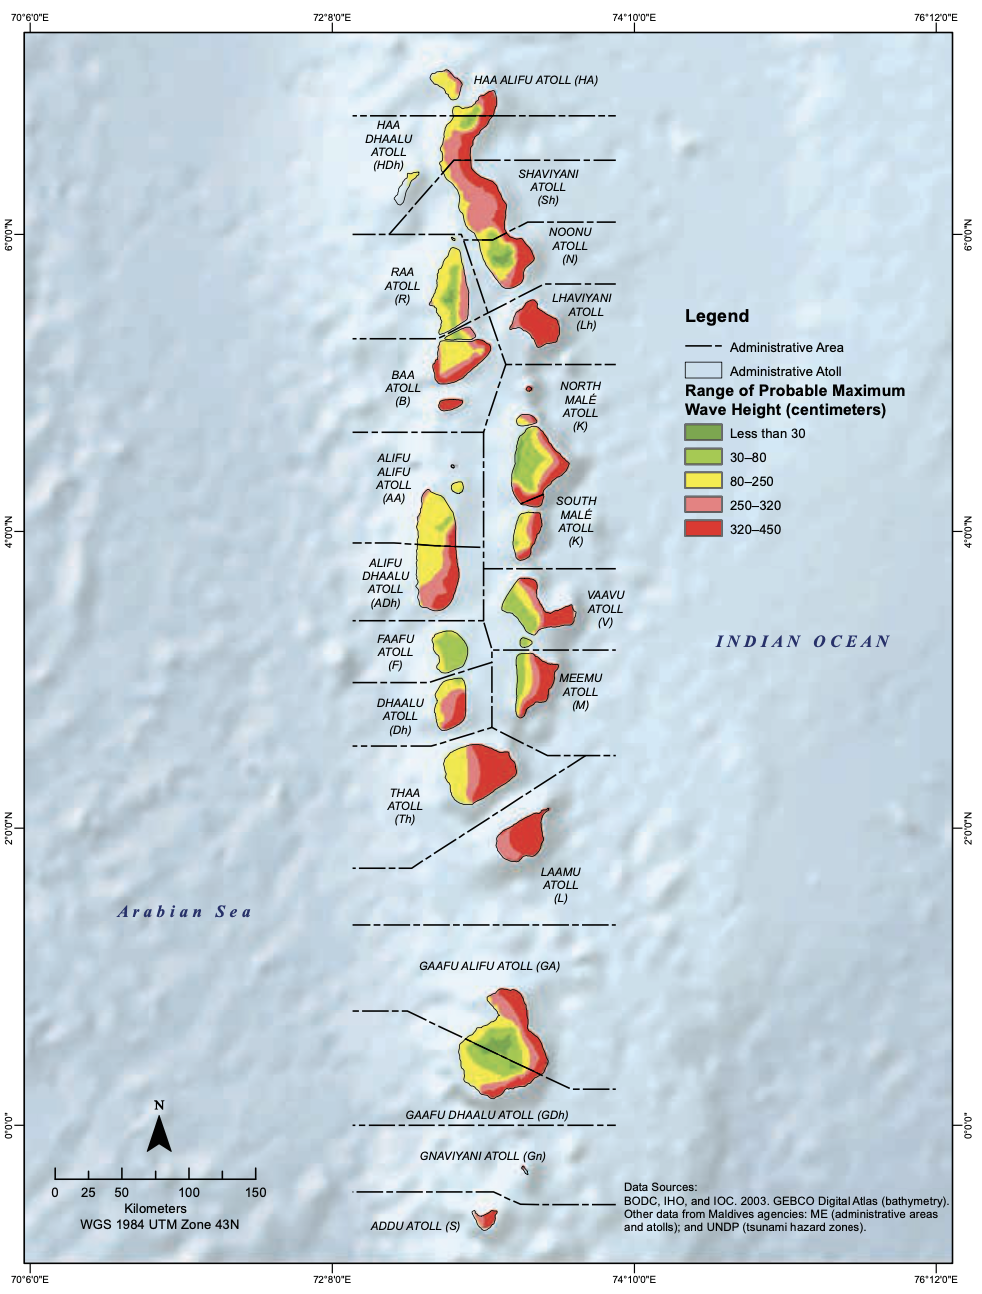
Understanding Hazard Exposure
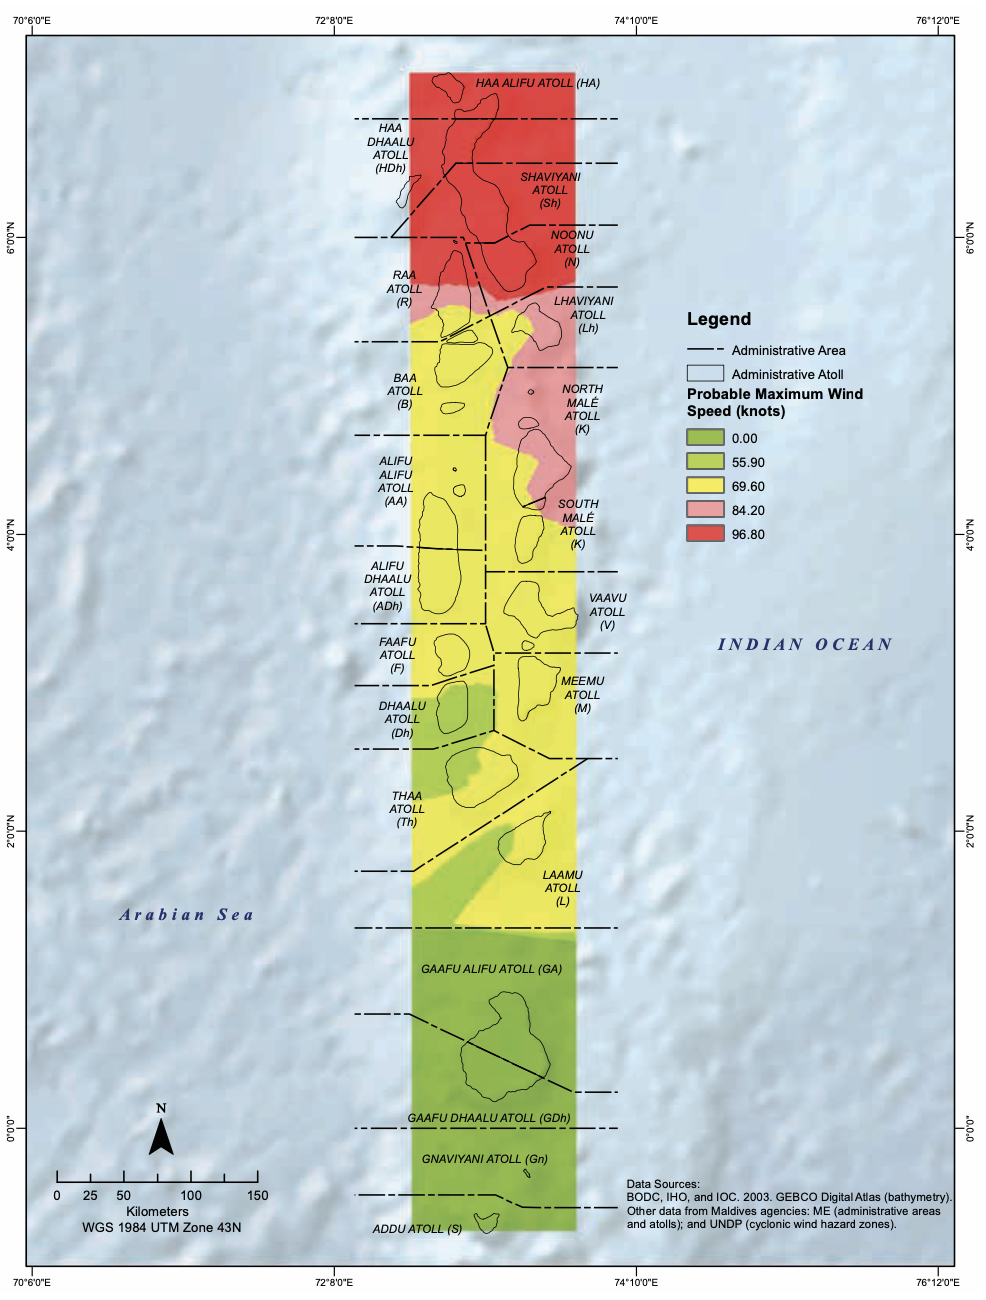
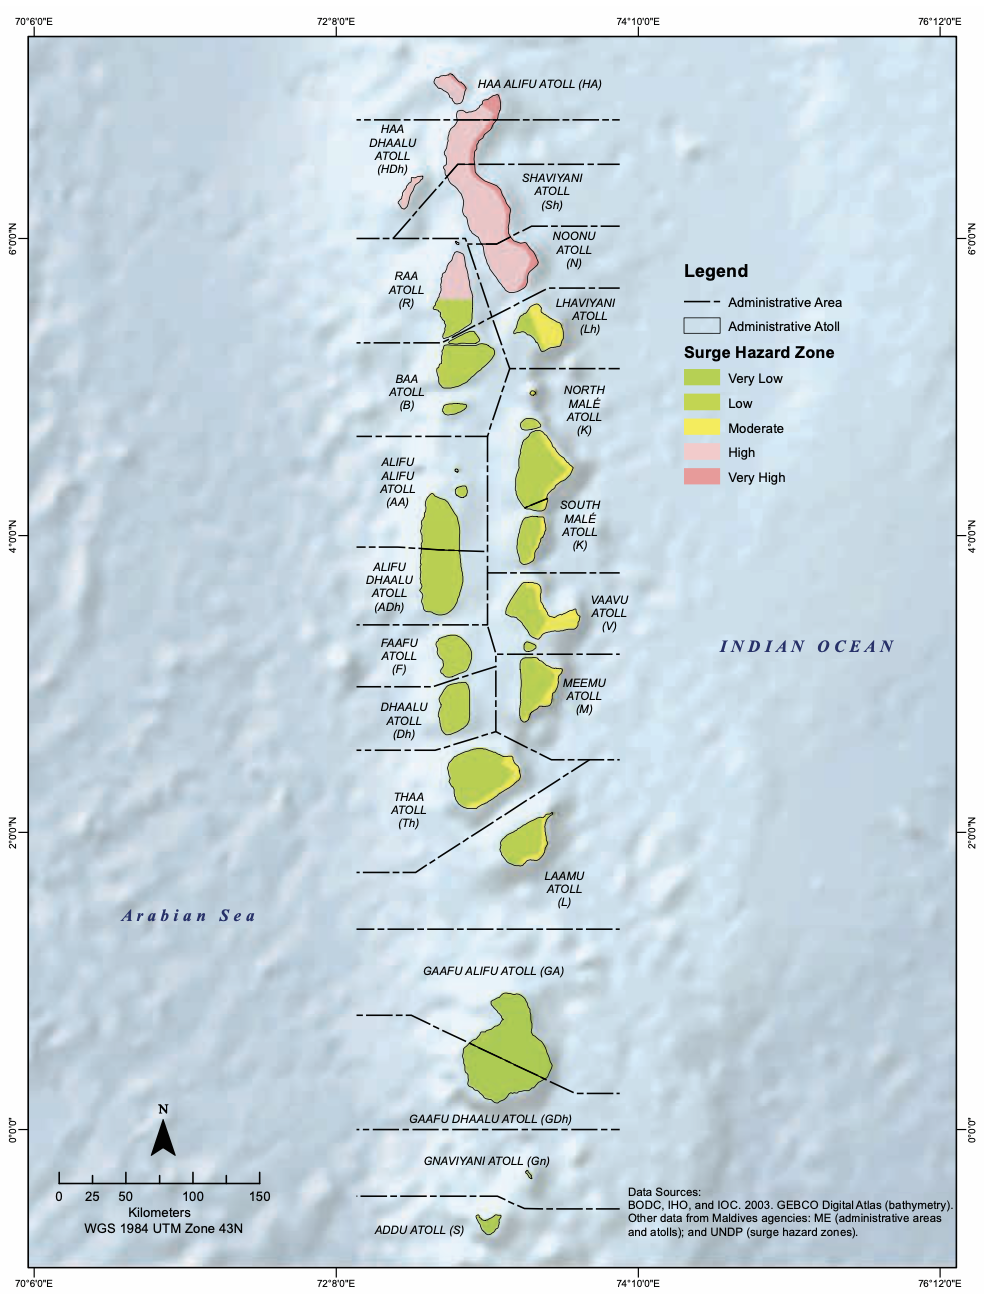
The Atlas also examines geophysical hazards including cyclonic wind zones, storm surges, tsunamis, and seismic activity that pose additional threats to the islands. Integrating this information into land-use and infrastructure planning is critical for long-term resilience. These visual tools enable policymakers, councils, and communities to identify high-risk zones and take preventive action before disasters occur
Understanding Future Climate Scenarios
Using advanced climate models, the Atlas also projects a future that is warmer and wetter. Under both moderate (RCP 4.5) and high (RCP 8.5) greenhouse gas emission scenarios, rainfall is expected to increase in the northern and central atolls through mid-century, accompanied by a gradual rise in temperature across all regions.
These projections are more than numbers on a chart, they highlight a changing environment that will shape the country’s future.
A wetter climate may increase the frequency of heavy rainfall and flooding, especially in urban islands where drainage systems are limited.
At the same time, longer dry periods could affect groundwater availability and freshwater storage in smaller islands.
Rising temperatures will place additional pressure on coral reefs, already stressed by warming oceans, and could influence fisheries and marine biodiversity that communities depend on.
For policymakers and local planners, these insights are crucial. They underscore the need to strengthen infrastructure design, coastal protection, and water management systems, and to invest in early warning and adaptation measures that anticipate these shifts rather than react to them.
![Map II.26: Maldives, Annual Average Rainfall Projection [2011 - 2020, 2021 - 2030, 2031 - 2040, 2041 - 2050] (RCP 4.5)](https://blr1.digitaloceanspaces.com/hushiyaaru-spaces/editor-images/1760639794598-ettrhbv8zko6w9p05ftnot.png)
![Map II.76: Maldives, Average Annual Temperature Projections [2011 - 2020, 2021 - 2030, 2031 - 2040, 2041 - 2050] (RCP 4.5)](https://blr1.digitaloceanspaces.com/hushiyaaru-spaces/editor-images/1760639883280-yuqjf76yf0h5qug4z9ks9c.png)
Learning from Data, Preparing for the Future
The Multihazard Risk Atlas reminds us that resilience begins with understanding. By transforming scientific information into accessible insights, the Atlas helps decision-makers, educators, and communities see the bigger picture, how our islands are changing, where vulnerabilities lie, and what actions can make a difference.
Learning from these findings is vital. Each map and dataset offers an opportunity to deepen our understanding of the Maldives’ environment and prepare for the challenges that lie ahead. As the nation continues to face the realities of a changing climate, awareness and informed decision-making will remain essential to safeguard our islands, our people, and our shared future.
Explore the full publication:
Multihazard Risk Atlas of Maldives – Volume II (ADB, 2020)